Half of everything Airbus built in 2025 was an A321
Follow 785 aircraft from five final-assembly sites to six families and one ribbon dominates the picture: the A321, 387 aircraft wide — with a single German site building six in ten of them.
Follow 785 aircraft from five final-assembly sites to six families and one ribbon dominates the picture: the A321, 387 aircraft wide — with a single German site building six in ten of them.
Production numbers are usually reported as a league table — so many A320s, so many A350s. But a table hides the industrial question: which factory builds what? That's a flow, and flows want a Sankey diagram, where the width of every ribbon is the number of aircraft moving from a site to a family.
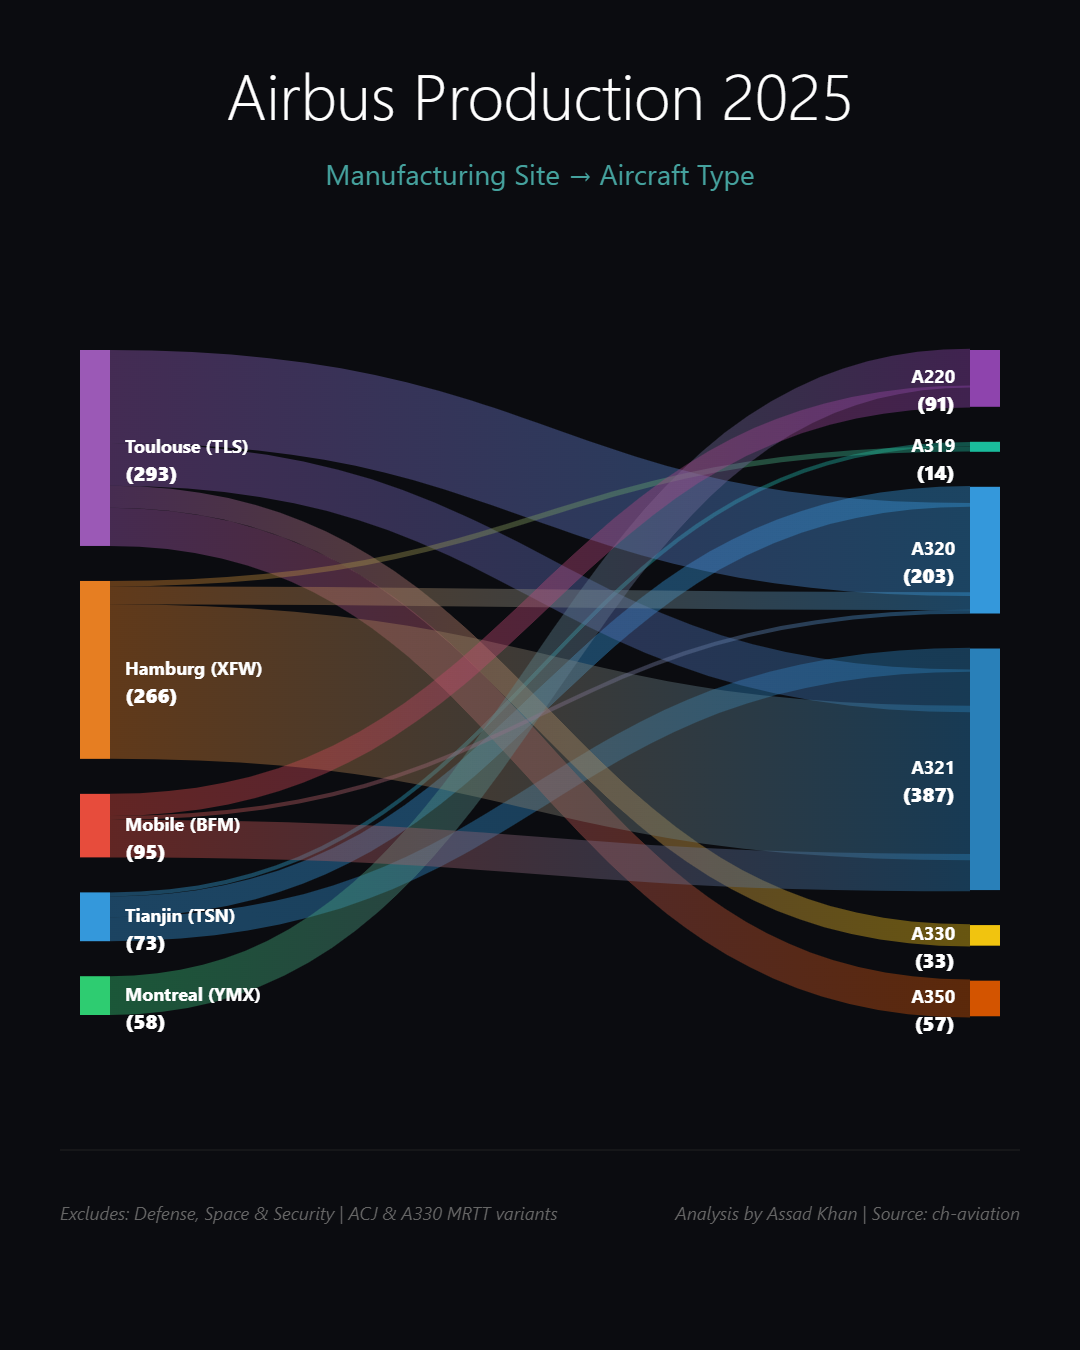
Of the 785 aircraft in the flow, 387 — 49% — are A321s. Add the 203 A320s and the single-aisle A32x line is three-quarters of everything Airbus assembled. The rest shares the margins: 91 A220s, 57 A350s, 33 A330s and a final 14 A319s. The market's verdict on the bigger narrowbody is the same one visible in the A321neo's market value: this is the aircraft everyone wants.
Toulouse remains the biggest site at 293 aircraft and the only one building widebodies in this picture — all 33 A330s and all 57 A350s. But Hamburg is the A321 machine: 231 of the 387, six in ten of the programme's star product, flow out of one German plant. Tianjin's 73 serve the Chinese market from within it; Mobile's 95 do the same for the US, split across A220s and A32xs; Montreal builds A220s only — 58, the type's design home.
That layout isn't sentimental. Final-assembly geography is strategy: tariff insulation, customer proximity, and political goodwill in the markets that — as the delivery map shows — absorb the most aircraft.
A Sankey earns its place when both ends of a flow matter and the quantities differ wildly. Encoding aircraft count as ribbon width makes the A321's dominance physical — you don't read 49%, you see half the ink leaving through one channel. Hover any ribbon for the exact site-to-family count, and every node is labelled in full: no codes, no legend-hunting. The colours separate sites, not families, because "who builds it" is the question this chart answers.
One row per flow — a source, a target, and a value. Chain them (site → type → customer) and the agent threads the whole river.
| source | target | value |
|---|---|---|
| Hamburg | A320neo | 231 |
| A320neo | IndiGo | 56 |
| Toulouse | A350 | 64 |
Novice tip: you only supply the links, one per row — the agent builds the nodes, their widths and the ordering. To show a multi-stage flow, just add more source→target rows that reuse the same names.
Airbus in 2025 is operationally a narrowbody company with a widebody boutique attached: one aircraft family is half the flow, one site builds 60% of that family, and the assembly map mirrors the demand map. When a single ribbon carries that much of the business, the whole system's health depends on it — which is exactly what a flow diagram is for noticing.
Have flow data of your own — supply chains, budgets, traffic? The AK.VIZ agent will propose a Sankey when your data genuinely is a flow (and something better when it isn't — see how to choose the right chart). Or browse the portfolio.