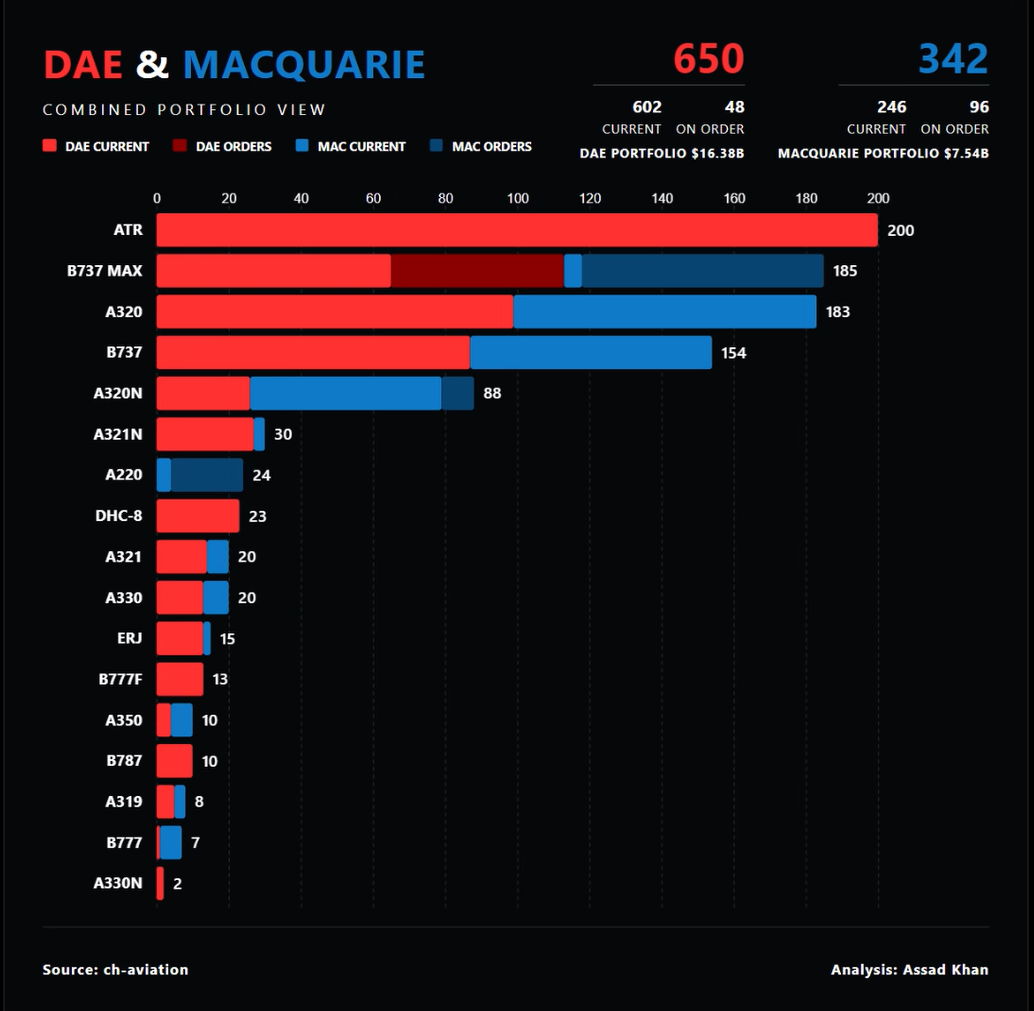
Two lessors, side by side: scale versus committed growth
DAE Capital manages 602 aircraft worth $16.38B; Macquarie AirFinance manages 246 worth $7.54B. But put the portfolios type-by-type on one chart and the more interesting difference isn't size — it's what each has ordered next.
Aircraft lessors own roughly half the world's commercial fleet, yet their portfolios are usually reported as two numbers: aircraft count and book value. That hides everything an investor or an airline treasurer actually wants to know — which types, how old a technology, and how much growth is already committed. This chart compares two portfolios at the type level, morphing between them so the structural differences move.
DAE Capital vs Macquarie AirFinance, fleet composition by type, current and on order. Open the interactive version → Source: ch-aviation.
Two very different shapes
DAE's 602-aircraft portfolio has an unusual signature: 200 ATR turboprops — a full regional-aircraft franchise inside a mainline lessor, flanked by 99 A320s, 87 B737s and 65 B737 MAXs, and topped with a widebody book that runs from A330s to 777 freighters. It's a diversified estate: narrowbody core, turboprop annuity, cargo optionality.
Macquarie AirFinance's 246 aircraft are almost purely narrowbody: A320 (84), B737 (67), A320neo (53), with only a handful of widebodies. No turboprops, no freighters — a focused single-aisle book concentrated exactly where liquidity and remarketing are easiest.
The order book is the strategy
The sharpest contrast is committed growth. DAE has 48 B737 MAXs on order against 602 current aircraft — an 8% top-up. Macquarie has 96 on order against 246 — 39% growth already committed, split across 67 MAXs, 20 A220s and 9 A320neos. One portfolio is maintaining altitude; the other is climbing hard, and buying its way into a new type (the A220) while it does. Fleet plans, not press releases, are where lessor strategy is legible — the same way an airline's order book tells you its next decade.
Why the chart is built the way it is
Comparing two compositions is where grouped bars go to die — twenty types × two owners × two statuses is sixty bars of noise. The morph solves it: one layout per owner, animated between, so your eye tracks what changes — the ATR block collapsing, the A220 appearing, the order-book bars stretching. Current and on-order are visually distinct so committed growth never masquerades as today's fleet, and every type is labelled in full with exact counts on hover.
What your data needs to look like
One row per category, with a value column for each of the two things you're comparing.
aircraft_type
DAE
Macquarie
A320neo family
602
246
737 MAX
48
96
Novice tip: use the same category labels down the left for both sides — the agent mirrors them, then morphs the two into one combined portfolio. Don't pre-sort or pre-sum; it handles the ranking and the totals.
The takeaway
Size is the least interesting difference between these two portfolios. DAE is breadth — six aircraft families, a turboprop franchise, cargo — at maintenance-level growth. Macquarie is focus — nearly all narrowbody — with two-fifths of its current fleet size already on order. Neither is "better"; they're different bets on the same decade. The chart's job is to make the bets visible.
Have portfolio or composition data to compare — fleets, holdings, product mixes? Drop it into the AK.VIZ agent for three proposals on your numbers, or browse the portfolio and services.