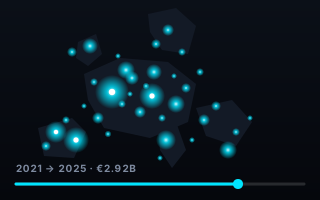
Take every Horizon Europe grant the EU itself classifies as artificial intelligence — 851 projects, 2021 to 2025 — and pin each recipient to its city. What you get is not a league table. It's a continent-wide constellation: 1,225 funded cities in 38 countries, played in the order the calls were signed.
The source is CORDIS, the EU's own public register of research projects, republished on data.europa.eu under CC BY 4.0. It is a remarkable file: the exact EU contribution to every organisation in every project, the recipient's street address with coordinates, an SME flag, and — crucially — the EU's own euroSciVoc science-vocabulary classification. We used that classification, not keyword guessing, to isolate AI: a project counts if the EU's taxonomy places it under artificial intelligence. That yields 851 projects worth €3.02B; restricted to recipients in geographic Europe, €2.92B across 3,849 organisations.
Then, instead of charting it, we played it. The map is a player: press play and 2021's calls light first — Paris, Barcelona, München — then four more years pour in, a top-cities rail re-ranking as the totals build. Circle area is EU contribution. By the end, the continent glows in 1,225 places.
The AI money map — press play, scrub the years, hover any city. Open the interactive version → Source: European Union, CORDIS via data.europa.eu, CC BY 4.0.
Paris pulls clear
One city separates itself. Paris takes €127.0M across 155 projects and 78 organisations — by the end of 2023 it sits €26M clear of everyone, and nothing in 2024 or 2025 closes the gap. Barcelona follows at €85.9M, then München at €80.6M, Madrid at €73.2M, Roma at €56.1M. München's profile is the most distinctive of the five: its money flows through just 30 organisations — half Barcelona's count for most of the total — a concentration story rather than an ecosystem story.
The real finding is dispersion
Here is the number that surprised us: the top ten cities together hold just 21.6% of the money. Nearly four euros in five land outside the marquee capitals — in Leuven (€36.8M through 10 organisations), Graz (€30.4M), Eindhoven (€30.3M), Getxo on the Basque coast (which posts €10.5M in 2025 alone). Europe's AI programme is not a two-hub race like the venture-capital map; it is deliberately, structurally spread. Whether that dispersion is a strength or a dilution is a policy argument — the map only shows that it is real.
More projects, smaller tickets
The five call years read as a clear arc. 2021 opens with €752M across 182 projects — an average of €4.1M per project. Each year after signs less money: €639M, €632M, €532M, and €365M so far in 2025. But 2025 signs the most projects of any year: 203, at an average of €1.8M — under half the 2021 ticket. The file doesn't say why, and neither do we; it only says the shape changed: fewer euros, more recipients, smaller grants.
Who the money actually reaches
Every organisation carries an SME flag, so the question "how much reaches small companies?" has an exact answer: €528.3M — 18.1%. The rest flows to universities, research institutes and large firms. And the mix varies sharply by city: Berlin, Athina and Bruxelles each send roughly 30% of their AI money to SMEs, while München sends 4% and Paris 8%. Same programme, very different local economies underneath it.
Why the chart is built the way it is
The projection is the EU's own. The map uses an azimuthal equal-area projection centred like EPSG:3035 — the official Eurostat standard for EU statistical maps. Equal-area matters here: circle area encodes money, so the ground beneath the circles must not distort area either.
It plays because the data is dated. Every euro carries its call year, so the honest way to show five years is to pour them in order, not to average them. Counters interpolate between years but snap to exact computed totals at every stop — the number you read at "2023" is the real cumulative figure, not a tween artifact.
The boundary choices are printed on the piece. Recipients without published coordinates (€31M, about 1%) and territories outside the map frame (€2.5M — Réunion, the Canaries, Svalbard) are declared in the footer, not silently dropped. Non-European partners (€64M, largest Israel at €35M) are excluded by the "geographic Europe" rule the subtitle states.
The addresses needed forensics. CORDIS city strings are postal, not geographic: Paris appears as "PARIS", "Paris Cedex 07", "PARIS 15"; Praha as "Praha 1/6/8"; Dublin as "Dublin 2". Left unmerged, those artifacts would have split Paris into four fake cities and understated it by €7M. We normalised 29 postal variants back to their real cities before aggregating — the kind of cleaning that never shows in the final image and completely changes its numbers.
What your data needs to look like
To get a played map like this from the AK.VIZ agent, your file needs one row per recipient (or event) with a place, a value and a date — that's all:
city
country
lat
lon
amount_eur
year
Paris
FR
48.8566
2.3522
1250000
2023
Leuven
BE
50.8798
4.7005
340000
2024
Coordinates are ideal but optional — a clean city + country pair can be geocoded.
Novice tip: don't pre-aggregate by city or year — hand over the raw rows and the agent sums, normalises the postal variants ("Paris Cedex 07" → Paris) and builds the year-by-year totals itself. One row per payment, grant or shipment is exactly right.
The takeaway
Funding registers, grant databases and subsidy files are usually flattened into bar-chart league tables that keep only ten rows of the truth. Keep the geography and the dates and the same file becomes a place-by-place, year-by-year record you can replay — and the finding changes from "who is first" to "how the whole continent moves".