581,705 layoffs, drawn as one wave
Between March 2020 and December 2025, tech companies announced 1,745 rounds of layoffs. We summed every one of them by month — and the shape that emerges tells a sharper story than any headline did.
Between March 2020 and December 2025, tech companies announced 1,745 rounds of layoffs. We summed every one of them by month — and the shape that emerges tells a sharper story than any headline did.
Layoff coverage arrives one press release at a time: a number, a company, an apologetic memo. What you never get is scale — how this round compares to the last one, whether the pace is accelerating, whether the industry is convulsing or just breathing. So we put all six years in one frame.
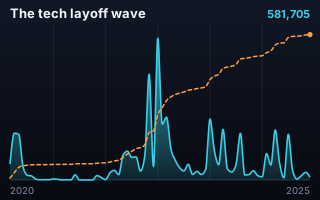
2020 — the first surge. The wave jumps almost from a standing start: 61,610 people in ten months, concentrated in travel, mobility and consumer startups. April and May alone account for 43,268 of them.
2021 — the quiet year. Here is the strangest number in the whole dataset: 6,790 people all year. That is roughly a tenth of what January 2023 would record on its own. For twelve months the wave sits almost flat on the axis — the single most striking feature of the chart is an absence.
January 2023 — the crest. 66,329 people in a single month, the worst of the era, from 108 separate announcements. Google's 12,000 and Microsoft's 10,000 land within two days of each other. This is where the cumulative line bends hardest: the fourteen months from June 2022 to July 2023 carry 261,284 people — 45% of the entire six-year total.
2024–2025 — the plateau. The correction was supposed to end; instead it settled into a rhythm — 122,315 people in 2024, 86,202 in 2025. Still roughly thirteen times the 2021 total. And here sits the era's quiet shock: the single largest cut of all six years is Intel's 22,000 in April 2025 — not in the famous 2023 wave at all.
Buried in the six years are 77 announcements where a company cut 100% of its staff — 21,485 people, and the end of the company. They are almost all small. The same word, "layoff," describes Amazon releasing a slice of a workforce the size of a city, and an eight-person startup switching off the lights.
Scrubbing the wave month by month makes the mix visible: hover January 2023 and it names Google, Microsoft and Amazon; hover a quiet month in 2021 and the largest name in it employs a few hundred people. The monthly total is one number, but it is never one kind of event.
A note on craft. The source file — a maintained Kaggle dataset built on the layoffs.fyi tracker — arrived labelled cleaned. Six of its company names had been mangled by a careless find-and-replace that turned every "sf" into "San Francisco Bay Area": SaleSan Francisco Bay Areaorce for Salesforce, WeTranSan Francisco Bay Areaer for WeTransfer, MiSan Francisco Bay Areaits Market for Misfits Market. We repaired all six before drawing anything, and said so in the chart's footer. Trust in a chart is built in exactly these boring places — which is why our agent audits every generated chart against its source data before delivery.
The first version of this chart drew all 1,745 events individually — one bubble each, area-proportional, packed around a midline like a seismogram. It was faithful to the data and almost unreadable. With that many marks the chart has to be laid out large and then shrunk to fit the screen, and every label shrinks with it. On a laptop the company names became unreadable. Faithfulness that nobody can read is not faithfulness; it is decoration.
So the events are summed by month instead. Two encodings carry the story: the filled wave is the flow — how many people lost a job in that month — and the dashed line is the stock, the running total climbing to 581,705. Flow shows you the rhythm; stock shows you that the rhythm never resets. Four era bands carry their own totals, and four annotations are placed by hand rather than by a solver, because with a known series a handful of chosen anchors will always beat an algorithm fighting the curve.
The texture is not lost, it moved: scrub any month and it gives you the total, the number of separate announcements, the running total, and the three largest cuts by name. Every headline figure — 581,705 people; 66,329 in the worst month; the 2021 total — is computed from the embedded data at render time, never typed. And because the chart draws into whatever space the browser gives it, with no scaling step, the labels are the same size on a laptop as on a monitor.
One row per event, with the date it happened and a size. Add a category or flag column and the agent will colour by it.
| company | date | people | shutdown |
|---|---|---|---|
| Example Corp | 2023-01-04 | 8,000 | no |
| Example Labs | 2023-01-20 | 350 | yes |
Novice tip: keep it one row per event — don't bucket by month yourself. The agent does the aggregating, and it needs the raw rows to find the peak month, count the announcements inside it and name the biggest cuts. Bucket it first and you throw away exactly the detail the tooltips run on.
Six years on, the wave has receded from its crest but not to quiet — and its composition has shifted. In 2020, 35% of the people counted worked at companies with 5,000 or more staff. By 2025 that share was 78%. Early in the era the cutting was concentrated in small companies; late in the era it is concentrated in large ones. The dataset records what happened, not why, but the shift itself is unambiguous — and it is invisible in week-to-week coverage.
Have a dataset with hundreds of events hiding a shape like this? Drop it into the AK.VIZ agent for three chart proposals on your real numbers, see more of the work, or read how to choose the right chart.